
Filtering Report Display
The report can be filtered by Start and End Dates, Funding Source, Grantee, Organization, and/or Program.

For example, with a date parameter of 6/1/2017 (start date) and 10/20/2017 (end date), if a child enrolled any time before 10/20/2017 and has either no discharge date or a discharge date after 6/1/2017, the child’s risk data will be included in the report.
Report Layout and Data Sources
The report is divided into three sections: how many and which risk factors do children have (bar graphs), and a child-level display that lists the risks reported for each child.
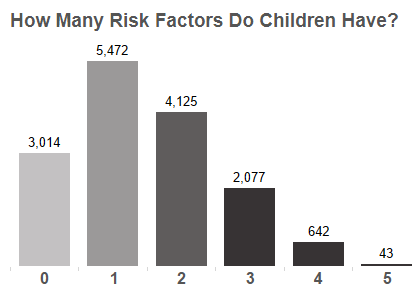
How Many Risk Factors Do Children Have?
Provides an unduplicated count of how many children have 0, 1, 2, 3, 4, or 5 risk factors reported
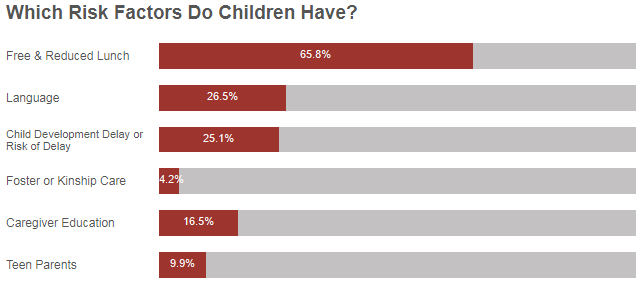
Which Risk Factors Do Children Have?
Displayed as a percentage of all children who fall within the selected filter parameters.
- Free & Reduced Lunch – based on Total Yearly Household Income reported in the Caregiver Profile
- Language – if a language other than English is reported as the primary child or caregiver language or if the child or caregiver reportedly speak a language other than English at home, the child will be counted in the language risk factor
- Child Development Delay or Risk of Delay – children who scored in the Needs Further Assessment zone on the ASQ-3 or are reported as having an IEP or IFSP on their Child Profile, will be captured in this count
- Foster or Kinship Care – children will be included in this risk factor if their Child Relationship to Primary Caregiver is anything other than son or daughter, as reported in the Child Profile
- Caregiver Education – based on level of education reported in the Caregiver Profile
- Teen Parents – inclusion in this count is based on the Caregiver’s age at the time of the child’s birth, calculated using the Caregiver DOB and Child DOB, as reported in their DAISEY profiles
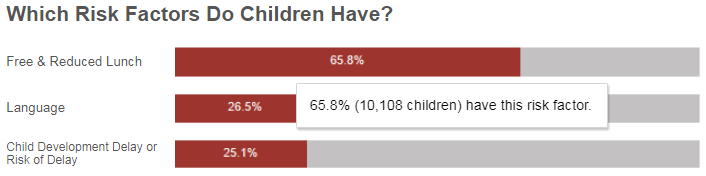
Tool Tip: Hover over a bar in any graph to see a pop-up summary of the data for that risk factor.
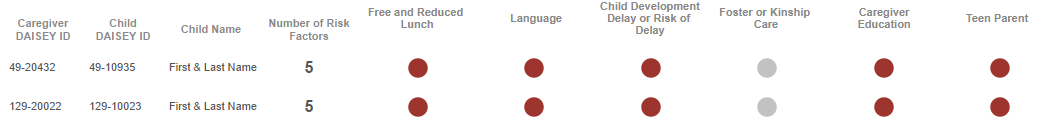
Summary Table of Children Included in Report
- Includes all children who were active in the selected date range and other filter parameters
- Provides child-level at-a-glance view of number of risk factors (0 – 5), with red dots indicating which risk factors are present (as reported in DAISEY)
- List dynamically updates to reflect filters applied within the graphs
(e.g., click on the red horizontal bar next to Child Development Delay or Risk of Delay in the Which Risk Factors Do Children Have? graph to generate a list of only those children with who have this risk factor reported.)
Accessing Underlying Client Level Data
You may access underlying data contributing to each graph in the report. Instructions for accessing underlying data can be found here:
https://kcctf.daiseysolutions.org/articles/accessing-underlying-client-level-data/