
The ASQ-3 Report presents ASQ-3 results for the organization or program as a whole as well as for individual children. Information presented in this report can be used for program planning, evaluation, and Quality Improvement activities as well as to track an individual child’s progress over time.
Using Tabs and Filters
Navigate between the dashboards by clicking on the tabs at the very top of the page (above the report title).
ASQ-3 data can be filtered by Date, Grantee, and Organization.

Main Dashboard: Data Source & Navigation
The Main Dashboard bar charts and table are generated from information contained in the Child Profile and ASQ-3 forms that are saved in DAISEY for a given grantee or organization and that fall within the selected date range. All children with an ASQ-3 whose date of activity falls within the date range selected are counted.
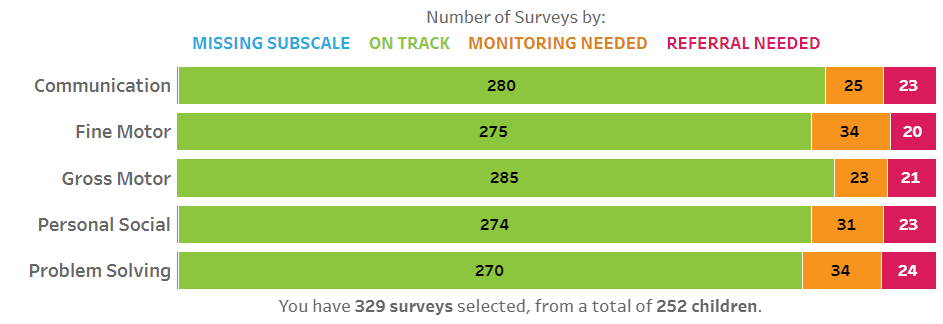
The bar chart displays number of surveys for each scoring results category (missing subscale, on track, monitoring needed, and referral needed) for each ASQ-3 subscale domain. The Missing Subscale category (blue bar) accounts for any blank subscale boxes in the ASQ-3 form in DAISEY. A summary statement of the total number of surveys and children that contribute to the graph is displayed directly below the bar chart.
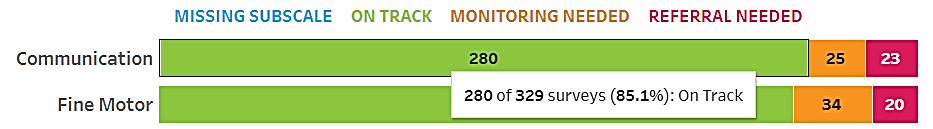
Hover over any portion of the bar chart to see additional information in the pop-up Tooltip.
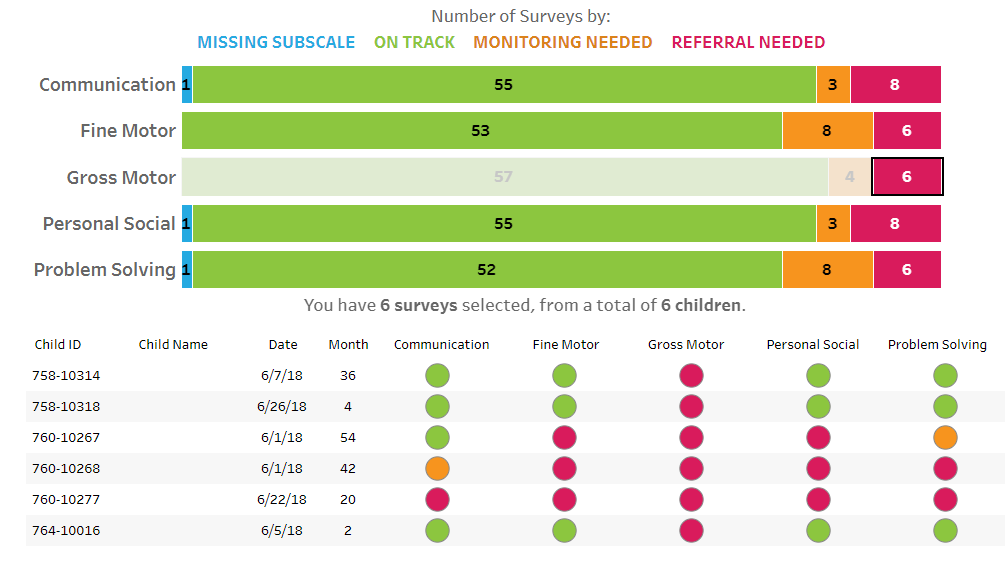
The bottom portion of the Main Dashboard is a table view of the surveys included in the bar chart. Here you will see the Child ID, Child Name, ASQ-3 Date of Activity, ASQ Screening Month, and colored dots for each of the five ASQ-3 domains. If a child has multiple ASQ-3 screenings completed within the selected date range, they will be displayed together in the table (see example in screenshot below).

Dynamic Dashboard Interactions: Selecting bars on the top half of the report will serve as a filter and dynamically update the ASQ list on the bottom half of the report. For example, if you select the red part of the Gross Motor bar, the bottom table will filter in accordance to display children with “Referral Needed” for Gross Motor during the date range selected (see image below). This filtering method can be used for multiple domains.
Trajectory Dashboard: Data Source & Navigation
The Trajectory Dashboard is generated from information contained in the Child Profile and ASQ-3 forms that are saved in DAISEY for a given grantee or organization and that fall within the selected date range.
All children with an ASQ-3 with a date of activity within the selected date range will appear in the Select Child list.
To populate the ASQ-3 domain graphs, select the child of interest from the child list. You can scroll through and select from the dropdown list or narrow the search by typing the first or last name or DAISEY ID into the search box.
For users with switch access to multiple grantees or organizations, the child list can be tailored down by adjusting the Grantee and/or Organization filters.
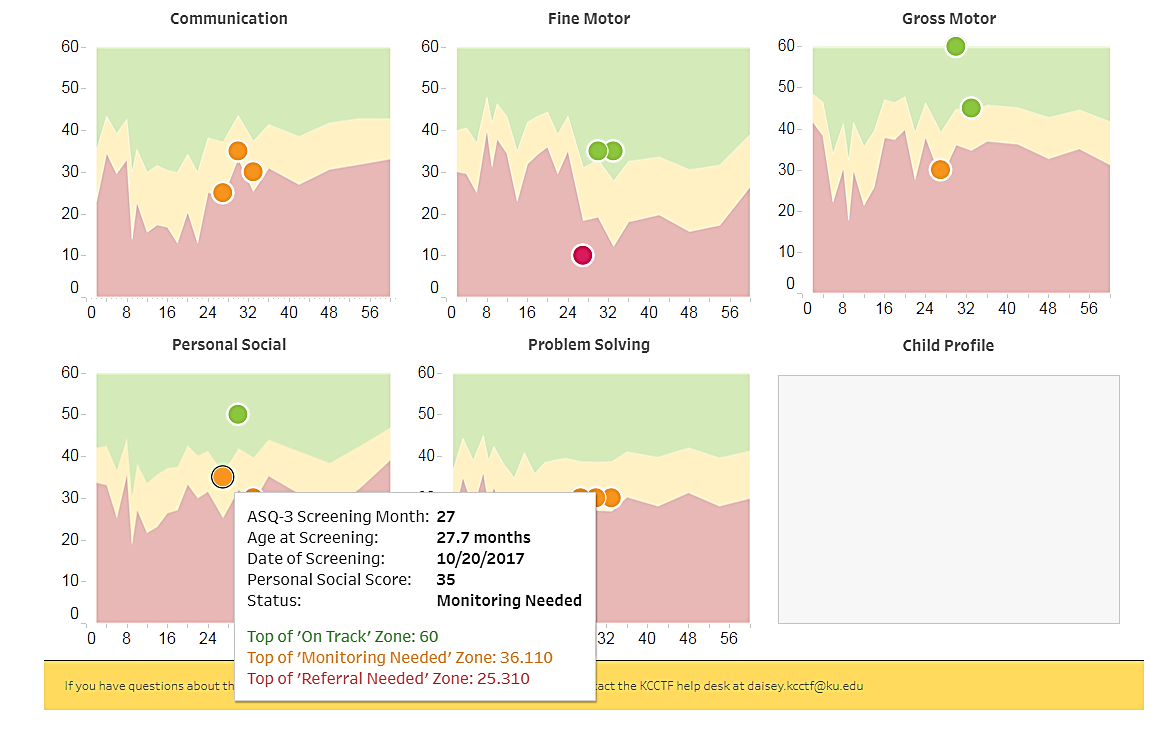
Once a child is selected, the dot on each ASQ-3 domain graph represents a saved ASQ-3 subscale score for that child. Hover over a dot to view additional information about that score within the pop-up Tooltip (see example snapshot below).
If results seem inaccurate, review the ASQ-3 in DAISEY to ensure each field is completed in the form. If you believe your saved forms are not displaying correctly in the report, send an inquiry to the DAISEY Support.