
The section below contains information about both of the tabs in the KCCTF ASQ-3 Report.
Using Tabs and Filters
Navigate between the dashboards by clicking on the tabs at the very top of the page (above the report title).
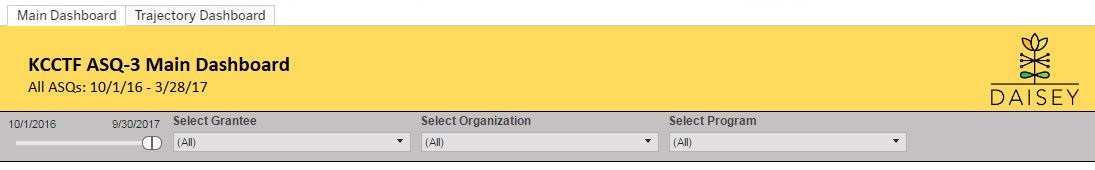
ASQ-3 data can be filtered by Date, Grantee, Organization, and Program.
Data Source for Main Dashboard
“Main Dashboard” is calculated from the “Primary Caregiver Profile”, “Child Profile”, and “ASQ-3” forms that are saved in DAISEY for a given grantee or organization, and that fall within the selected date range.
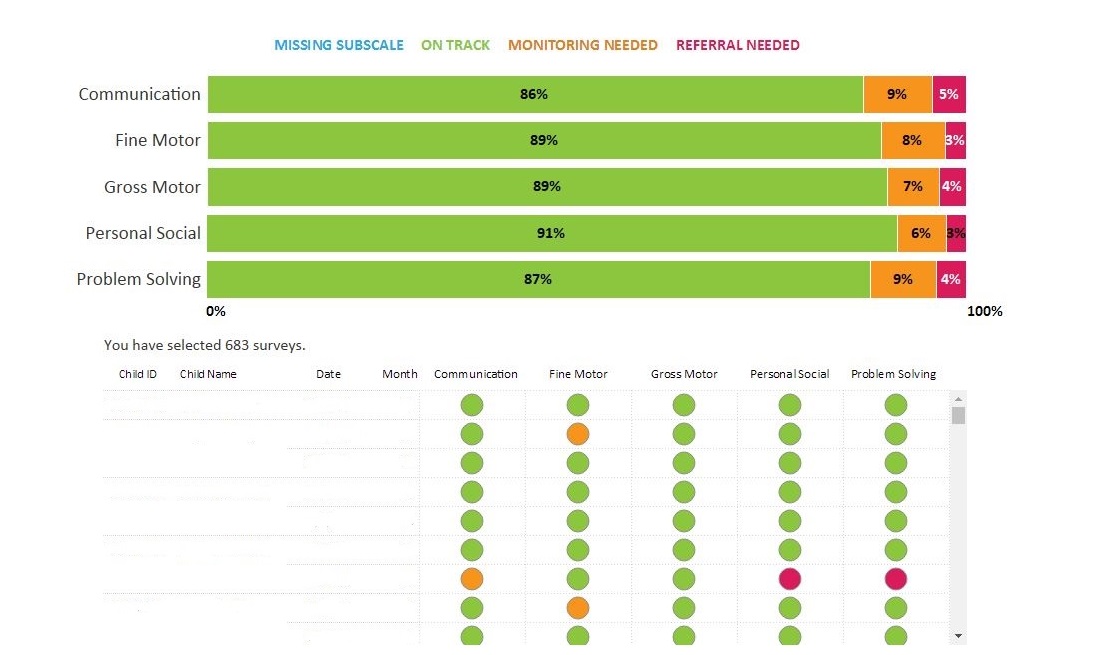
The questions considered are Child ID, child DOB, Date of Activity, Which Child was involved, Screening Month, and calculated scores for each domain. All children with an ASQ-3 whose date of activity is during the date range selected are counted.
Note: Selecting bars on the top half of the report will serve as a filter of the listed ASQ’s on the bottom half of the report. For example, if you select the green part of the Communication bar, the bottom table will filter in accordance to children that are ‘On Track’ for Communication during the date range selected. This sort method can be used for multiple domains. The Missing Subscale category accounts for any blank subscale boxes in the ASQ-3 Form in DAISEY.
Data Source for Trajectory Dashboard
“Trajectory Dashboard” is calculated from the “Primary Caregiver Profile”, “Child Profile”, and “ASQ-3” forms that are saved in DAISEY for a given child, grantee, or organization, and that fall within the selected date range.
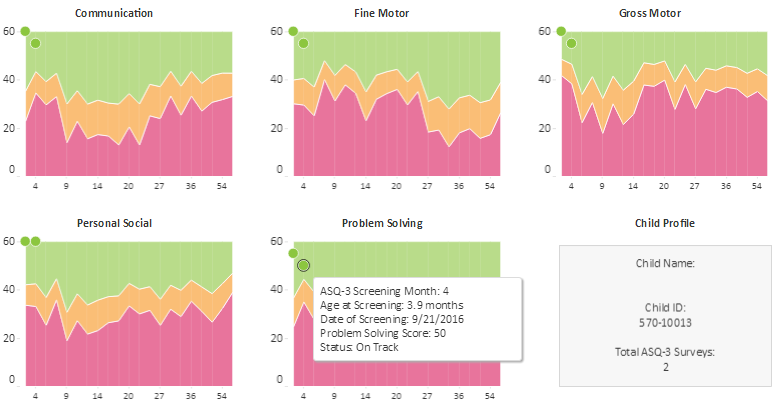
The questions considered are Child ID, child DOB, Date of Activity, Which Child was involved, Screening Month, and calculated scores for each domain. All children with an ASQ-3 whose date of activity is during the date range selected are counted.
Note: The dot on each ASQ-3 Domain graph represents a saved/submitted ASQ-3. Use the Tooltip to understand each dot (completed ASQ-3). If results seem inaccurate, review ASQ-3 in DAISEY to ensure each field is completed.